View Performance with Analytics Dashboard
New projects use the CLI flow. These pages stay available while you migrate. See how to move and the full list of Web Dashboard docs.
Once your API portal is hosted or embedded, you can analyze the performance of the portal through the Analytics Dashboard for specific API versions, and for any time duration.
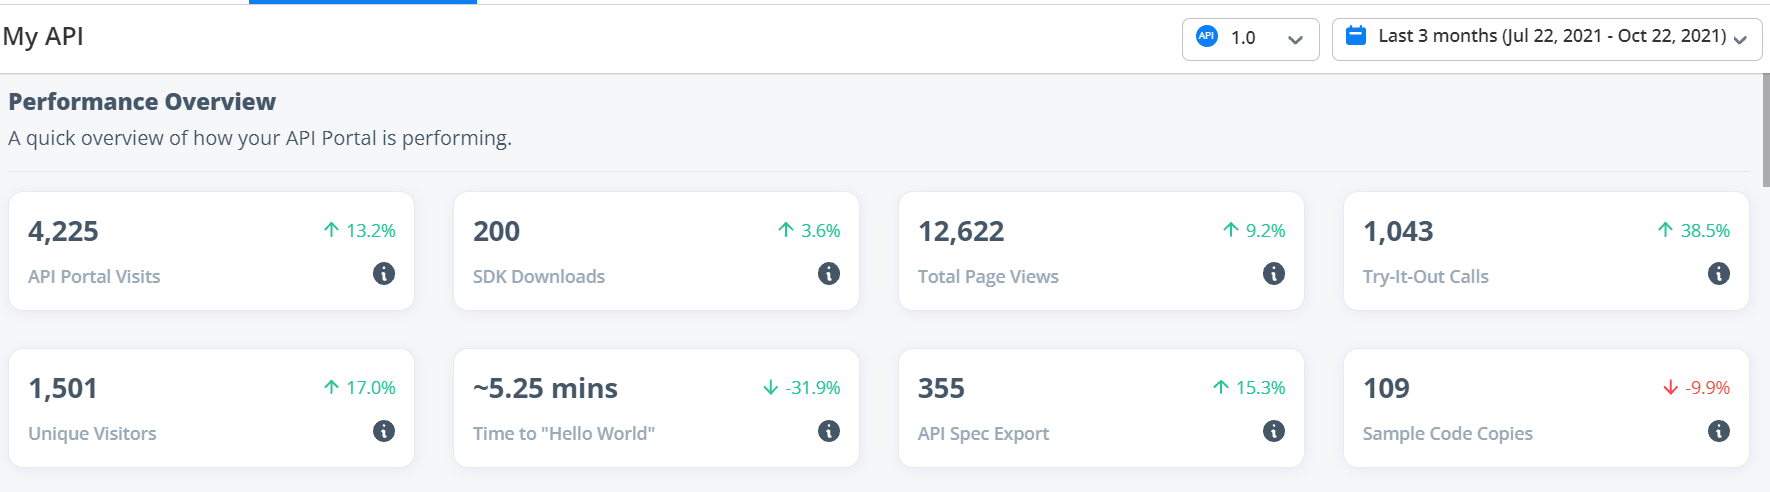
The dashboard contains detailed charts per language for the following metrics:
- API Portal Visits: Total number of visits to the API Portal. A page load for one platform/language counts as one visit.
- SDK Downloads: Total number of SDKs downloaded from the API Portal.
- Total Page Views: Combined number of views for all the pages that the API Portal documents. This includes Getting Started pages, Custom Guides' pages, Endpoints pages and Models pages.
- Try-It-Out Calls: Total number of API calls attempted from the API Code Playground.
- Unique Visitors: Total number of unique visitors to the API Portal.
- Time to "Hello World": Time that a new user takes to make their first successful API call using the API Code Playground. This time is calculated as an average of the times each user take to make their first API call that results in a successful (2xx) response.
- API Spec Export: Total number of API specification downloads.
- Number of Code Samples Copied: Total number of the code sample copies.
How to Access the Analytics Dashboard?
Login to the APIMatic Dashboard with your APIMatic credentials.
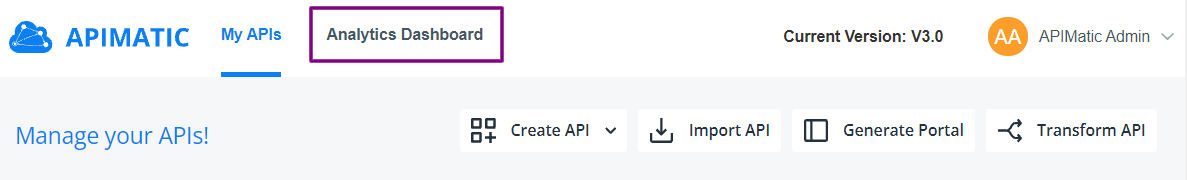
To access the analytics dashboard, click on the Analytics Dashboard option on the navigation bar.
- You can select the API version and time from the drop-down selectors in the dashboard's navigation bar to view the performance of your API documentation.

- The detailed charts can be expanded using the maximize icon, and you can also choose to hide the HTTP/Curl values on the charts accordingly.
Please note that the data is not shown in real-time; it takes 12 hours for new data to be visible on the Dashboard.
Performance Overview
The performance overview section gives a quick summary of all the metrics and whether the performance has increased or decreased during that time duration. To understand each metric, you can hover over the information icon for more detail.