About Extension Components
The APIMatic's VS Code extension makes two major contributions to the VS Code:
- An APIMatic API Explorer view container and
- Several status bar actions.
This document covers each of the above component in detail.
APIMatic API Explorer View Container
You will find all important views associated with the extension, in the APIMatic API Explorer view located in the Activity Bar. These views allow for easy API file navigation as well as for understanding validation issues better.

Full list of views associated with the APIMatic API Explorer view container is given below:
Workspace File Navigator View
The main purpose of this view is to make it easier for users to navigate through and work with files and folders involved in the API workspace.
This view offers the following functionalities:
- Open Files in the Editor
- Main API File Highlighting and Labelling
- Reveal All Main API Files
- Add an APIMatic Metadata File
- APIMatic Metadata Files Labelling
- Exclude File/Folder from API Workspace
- Refresh View
- Edit Files and Folders
- Collapse All Folders
Open Files in the Editor
Clicking on a file's name will open it in the VS Code Editor. However, only textual or non-binary files can be opened this way.
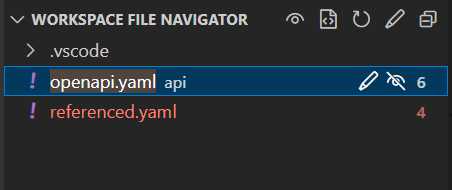
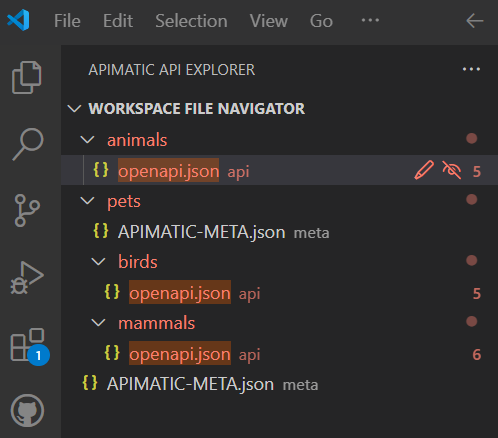
Main API File Highlighting and Labelling
To distinguish API definition's main entry files from other files, they are given a default background color and have an api label attached after the file name:

Reveal All Main API Files
If you are dealing with multiple API definitions in your API workspace or your main entry file for the API definition is nested within a folder, you can use the reveal feature to bring all main API files in the workspace directories into view. This will uncollapse all collapsed directory names to reveal nested items.
Hover near the Workspace File Navigator view title and click on the Reveal All Main API Files option as shown below:
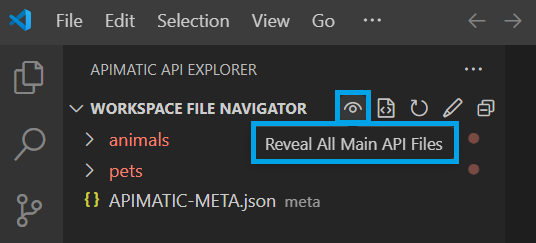
This will instantly expand all directories and reveal all highlighted main API files:
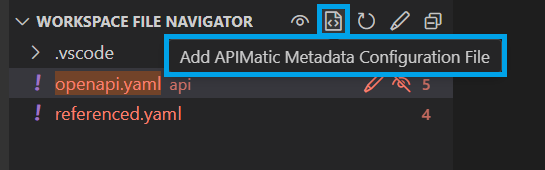
Add an APIMatic Metadata File
If your API workspace lacks an APIMatic Metadata file, the view offers an option to quickly add one:
Hover near the Workspace File Navigator view title and select the Add APIMatic Metadata Configuration File option as shown below:
You will be asked to select one or more configuration objects to initialize by default. Pick as per requirements:
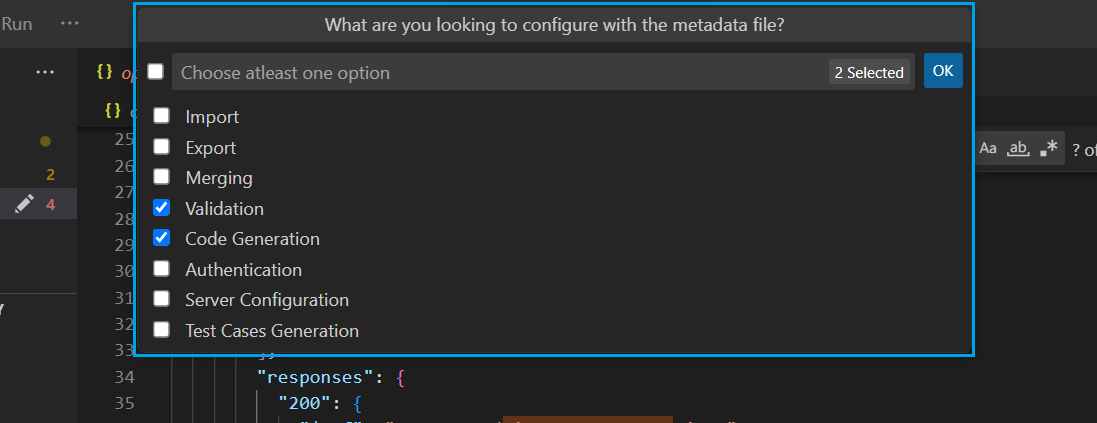
A metadata file with selected configurations will be instantly added in the API workspace:
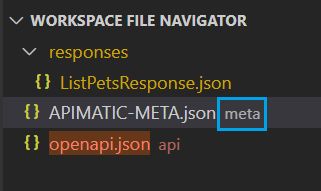
APIMatic Metadata Files Labelling
To distinguish APIMatic's Metadata files in the view from other files, a meta label is attached after their file name:
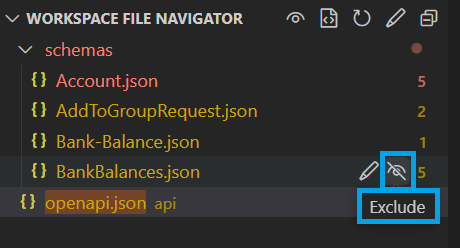
Exclude File/Folder from API Workspace
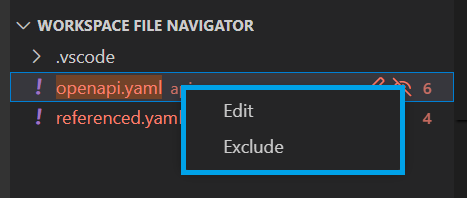
If your workspace contains files or folders that aren't directly linked to the API definition but are part of your API project only, it is recommended that you exclude them from your API workspace using the Exclude option in the Workspace File Navigator:
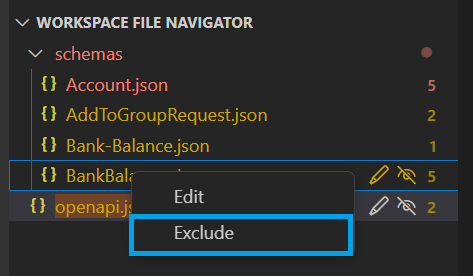
This option is also available in the context menu for each file/folder:
Excluding a file/folder adds its path to the root level .apimaticvscodeignore file (created from scratch if one doesn't exist already) of the API workspace in the form of a glob pattern:
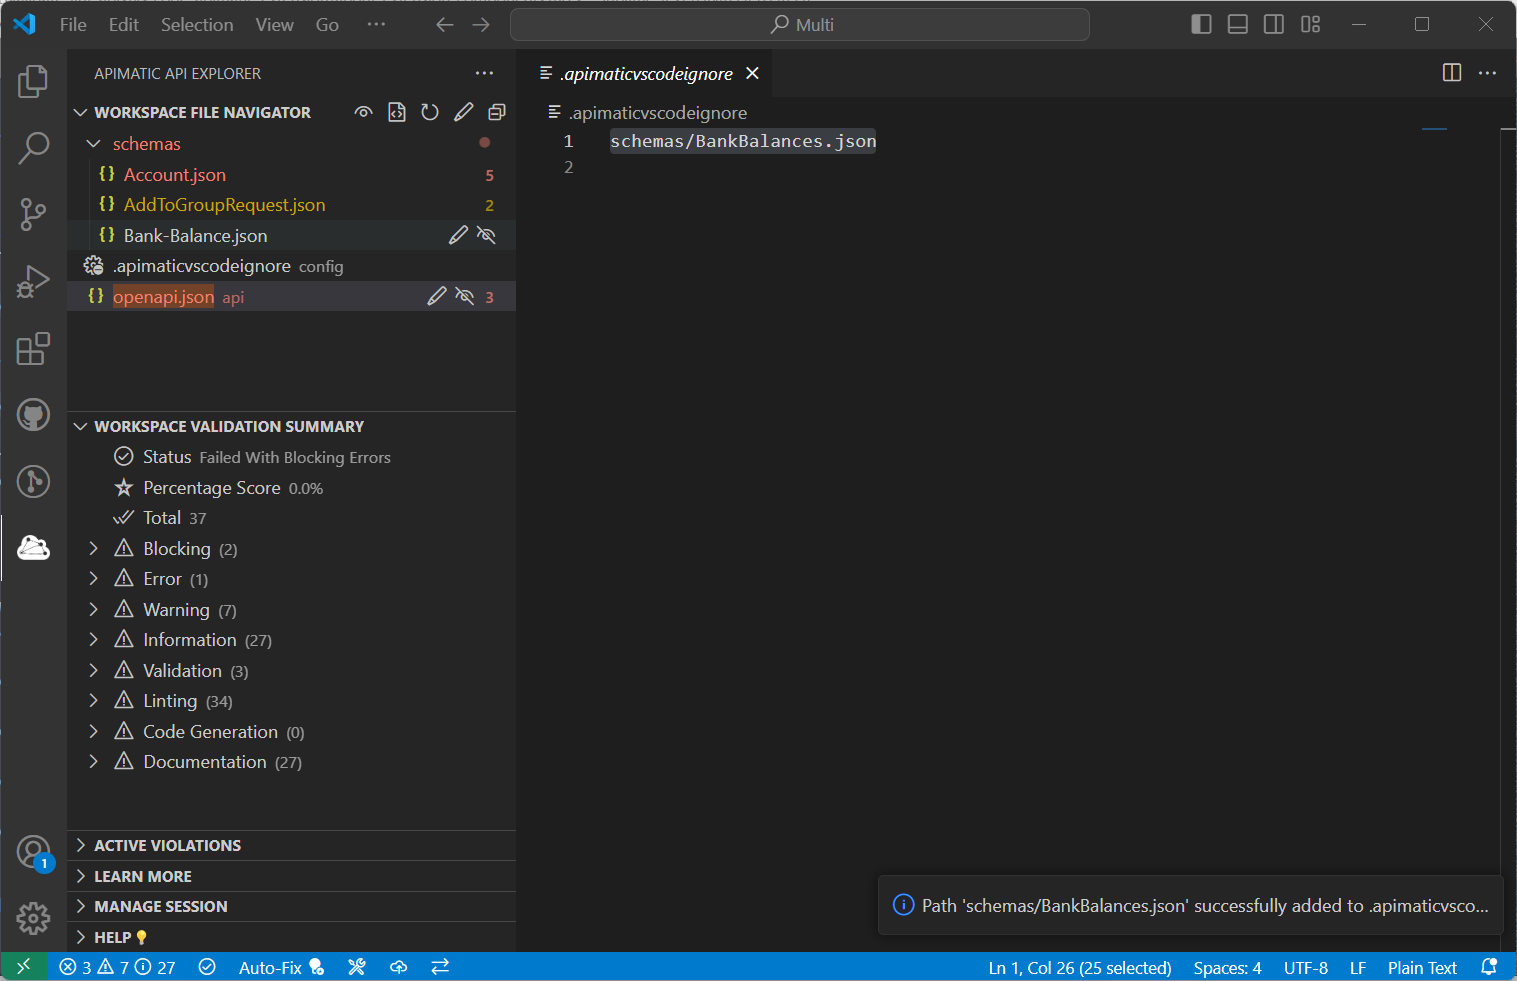
This action will also hide the file/folder from the Workspace File Navigator view. The extension will safely ignore all such files during validation and all other operations.
Refresh View
If the files/folders involved in the API workspace have changed outside the VS Code extension, you can refresh the navigator view to get updated information for each file and folder. This can be done by hovering near the Workspace File Navigator view title and clicking on the refresh (🔃) icon:
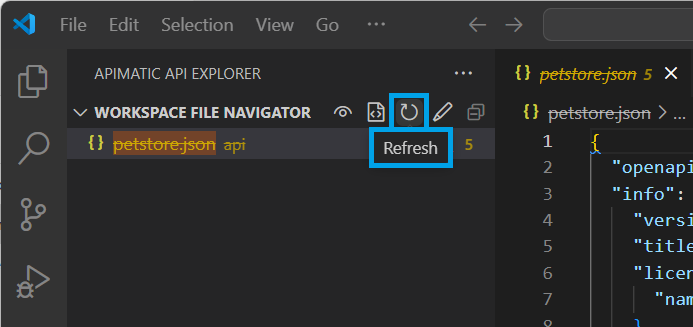
This will reload the files and folders as well as re-validate the workspace.
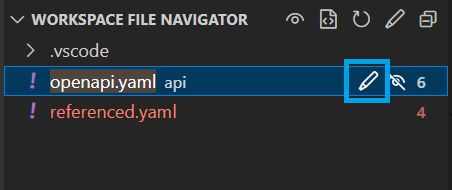
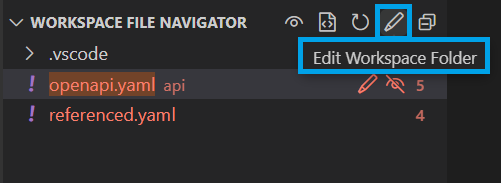
Edit Files and Folders
The files and folders in this view appear as read-only since basic file related functionalities (e.g. renaming, deleting or adding) are already available in the VS Code's Explorer view. If you still wish to perform some file/directory related actions, click on the pencil (✏️) icon that becomes visible on hover near the navigator view's title or the file/directory name:
Edit option near the file/directory name:
Edit option near the File Navigator view title:
Clicking on this will switch the active view to the Explorer and highlight your selected file/directory name in it so you can quickly perform required actions there.
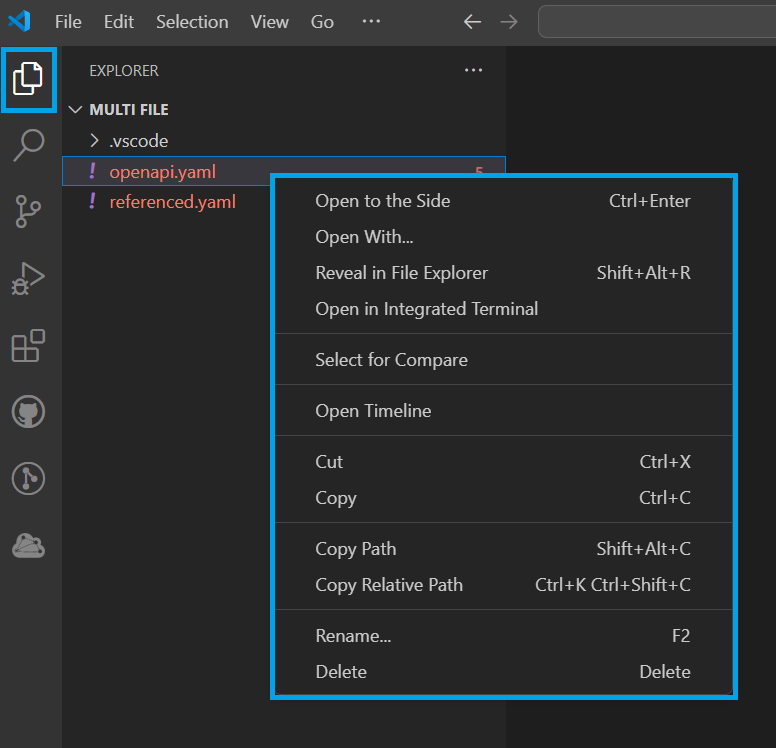
An alternative approach to doing this would be to open the context menu for a file/folder and clicking on the Edit option:
Collapse All Folders
To quickly collapse all folders in the API workspace, hover near the Workspace File Navigator view title and click on the collapse all icon:
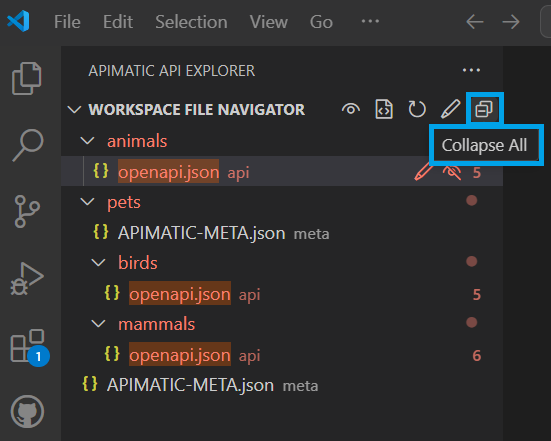
All expanded directories will instantly be closed.
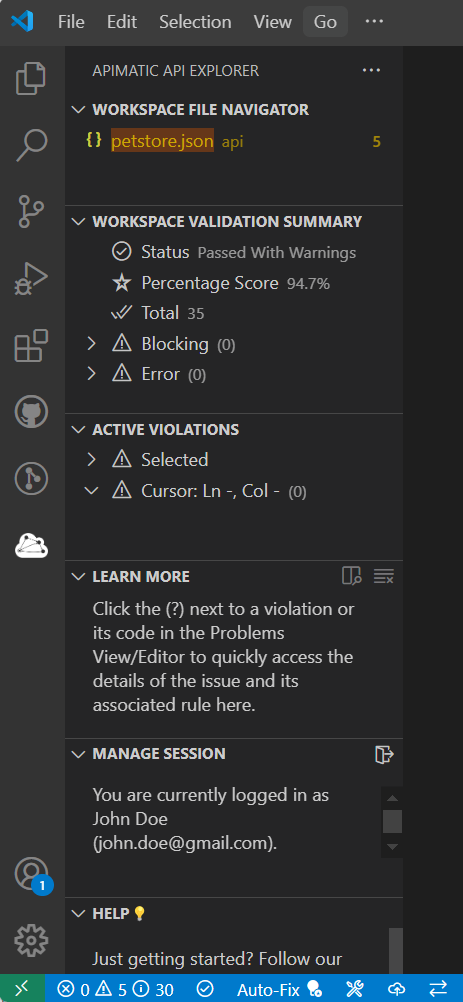
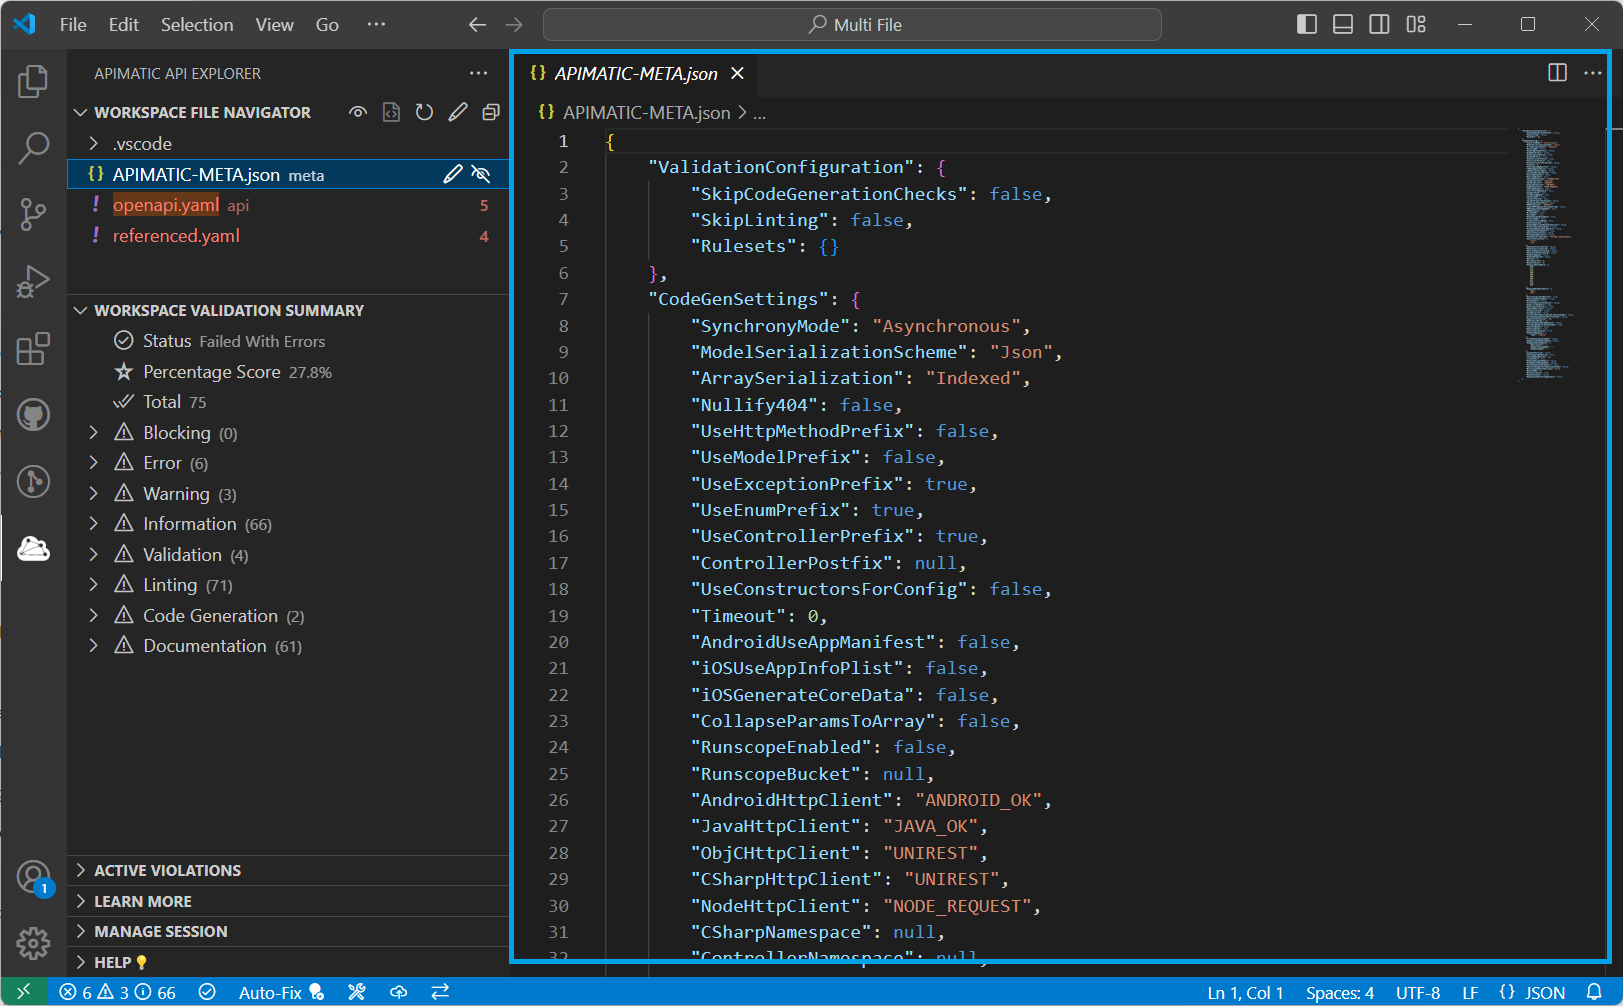
Workspace Validation Summary View
This view shows a summary of validation status of the complete API workspace.
Generate Reports
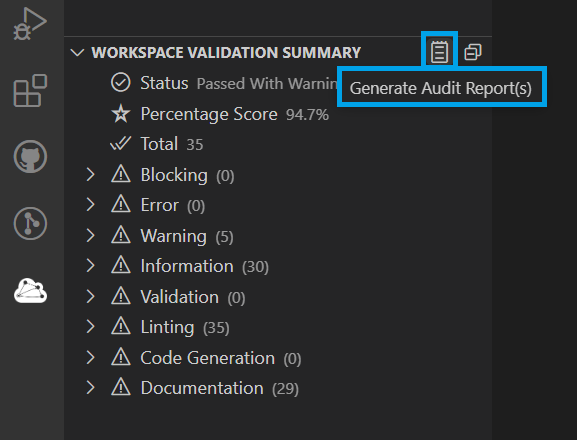
To share the validation summary with external stakeholders, you can generate one or more reports by clicking on the report (🗒️) button visible in the top right corner when you hover on the Workspace Validation Summary view title:
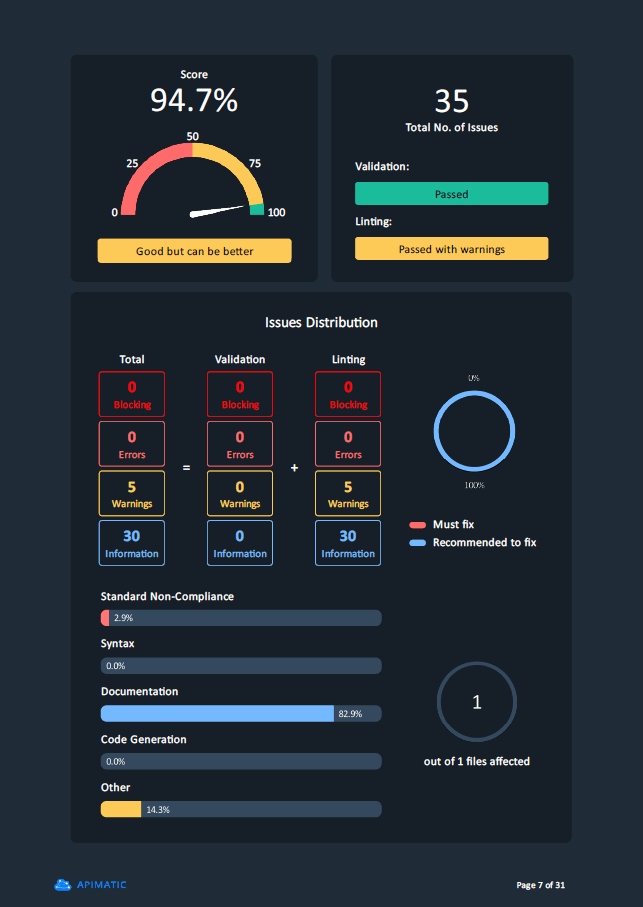
Here is a preview of a sample report generated with this option:
To learn more about generating reports, please check out our documentation here.
Validation Status
The overall pass/fail status is shown in the Status property. Possible values and what they mean are defined below:
| Status | Details |
|---|---|
| Passed | All files in the API workspace are valid and have no issues. You can safely proceed to generating desired output from your API definition(s). |
| Passed With Warnings | One or more files in the API workspace have some warnings but this won't be a blocker for generating an output from your API definition(s). |
| Failed With Errors | One or more files in the API workspace contain errors that need to be resolved before you can generate any output for your API definition(s). |
| Failed With Blocking Errors | One or more files in the API workspace contain blocker issues that are preventing the validation process from completing. Once these issues are resolved the validation process will resume and may detect more issues. No output can be generated from the API definition(s) unless all blocking issues (current and any upcoming) are resolved. |
The overall status is decided based on the severity of messages logged for the API workspace.
Score
Labelled as Percentage Score, this is another measure to help you quickly determine how good or bad your API workspace definitions are doing in terms of number of issues, severity, type of issues, etc. You should aim for a score above 80% to get a better output from your API definition(s) in any API tool.
Total Messages
Labelled as Total, this property shows the total number of issues present across all files in your API workspace. This includes a sum of issue types and their particular instances.
Messages by Severity
Validation issues/messages are grouped based on severity level to help you tackle blocker issues first followed by warnings and so on. The severity level is followed by a count of message instances that are of the selected severity level.
Validation/Linting Messages
Issues are also grouped based on whether they are validation messages or linting messages. The total count of message instances of the selected type is mentioned at the end of the label.
Code Generation and Documentation Messages
Issues that are likely to affect code generation output are grouped under the Code Generation category. Similarly, issues that can affect quality of auto-generated documentation are grouped under the Documentation category. The total count of message instances of the selected category is mentioned at the end of the label.
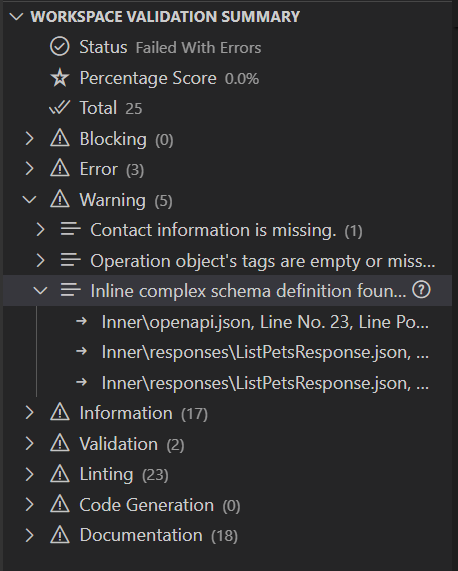
Instances Grouped by Message
At the top-level, the messages are grouped either by severity or based on whether they are validation or linting messages. Instances of messages belonging to these groups are further grouped on the message value. Label of such groups show the message value followed by a count of instances belonging to the message. This grouping can be useful if you want to tackle a particular issue and all of its instances first before moving on to another issue.
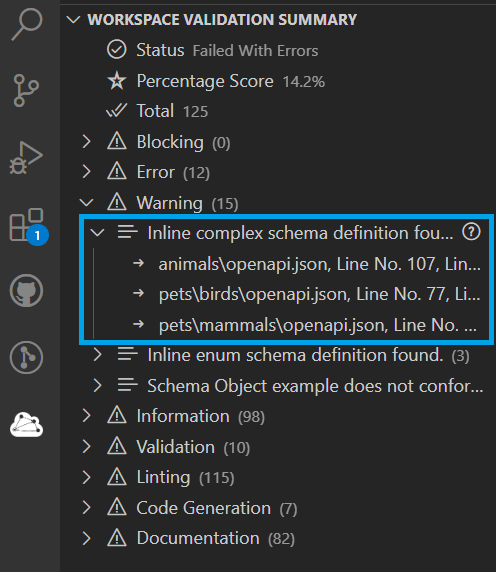
If you want to understand what a message means, view hints to resolve the issue or just want to see more details about the rule that the message belongs to, you can click on the (?) visible when you hover near the message value. This should open the Learn More View with all relevant details.
Navigating to a Message Instance
Message instances are likely to have a file and line/path information attached to them. Clicking on an instance will take you to where the instance is located by first opening the target file and then highlighting the target line in the file. In some cases, where the instance may not be directly associated with a file, a path information will be available and clicking on the instance will not have any effect.
Collapse All Nodes
If the information becomes overwhelming you can quickly collapse all nodes of the view using the Collapse All option from the right corner of the view title:
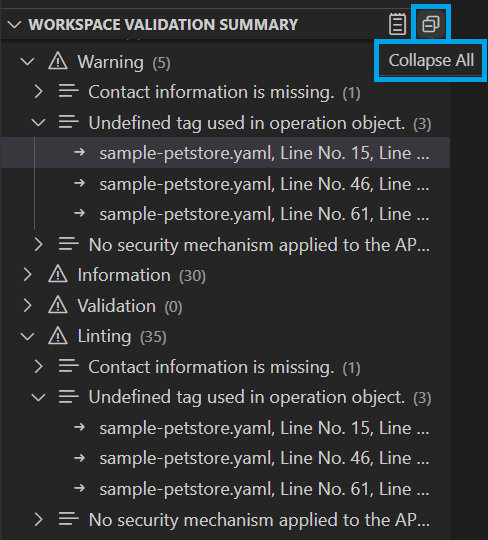
After collapsing, all inner nodes will be collapsed and only the root level ones will be shown:
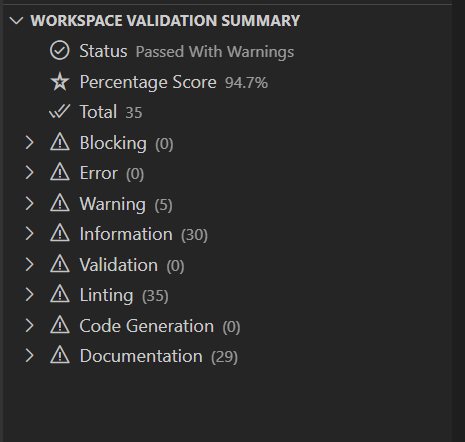
Active Violations View
This view provides additional contextual information for one or more violations that are currently active in either the Editor or in other views like the Workspace Validation Summary view.
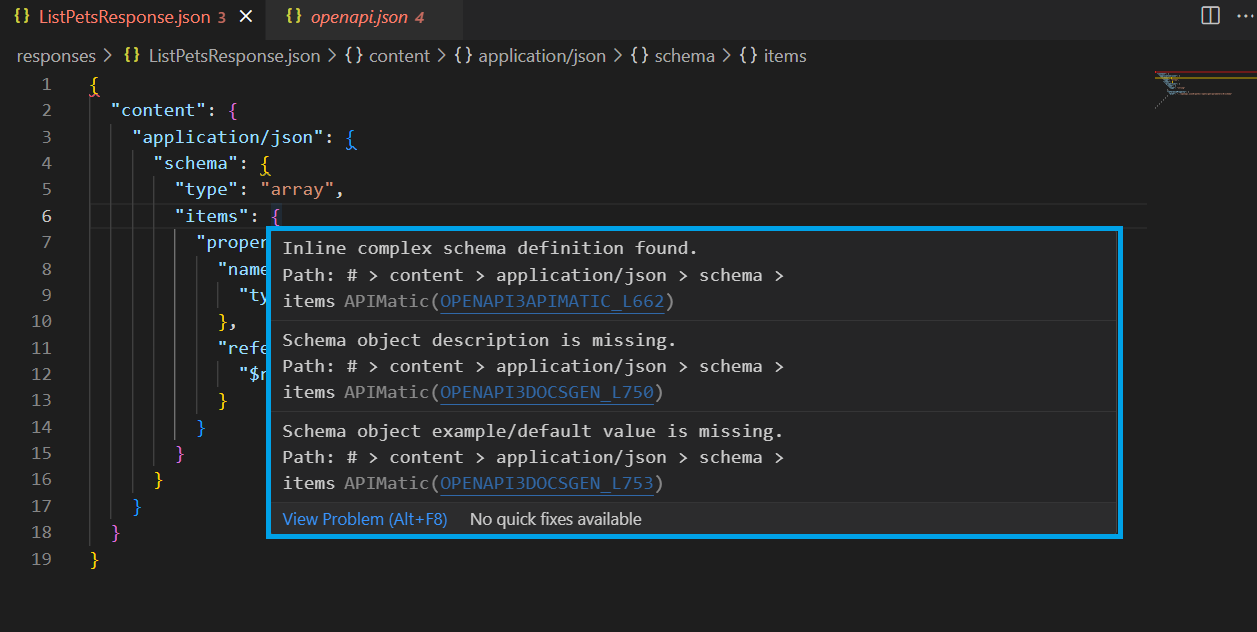
The information shown on hovering over a squiggly in the Editor, when working with an API workspace file, is quite limited. It is also possible that multiple issues exist at the squiggly point which makes the hover messages more confusing especially since they lack any severity information:
To make it easier to tackle issues at a particular point in the file open in the Editor, the Active Violations view updates itself with every cursor position change in the Editor and shows a list of issues/violations applicable at that position. For each issue, additional contextual information is provided as well to help users resolve issues more efficiently.
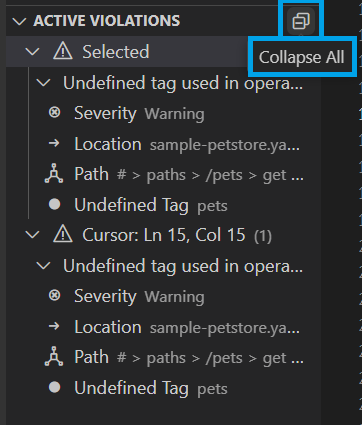
Selected
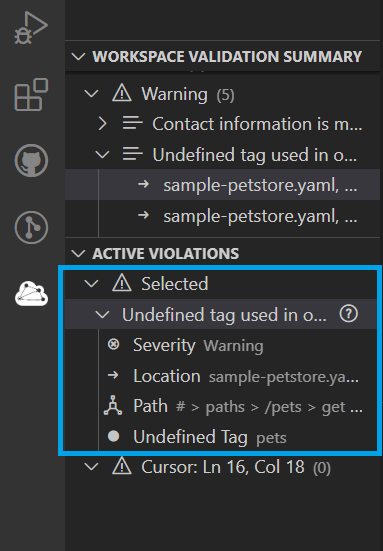
When a user selects a violation from either the list of violations from the Cursor property of the Active Violations view or from the Workspace Validation Summary view, the selected violation and its details are shown under the Selected property of the Active Violations view.
Cursor
This property shows the line number and position/column of your cursor in the active Editor followed by a total count of issues or violations nested inside it which are applicable at that particular position.
The data that is available for each violation is described in the next few sections.
Violation Message
For each violation the root node represents the message associated with the issue, visible to you when you hover over the squiggly in the editor and which describes the problem in few short words.
If you want to understand what a violation message means, view hints to resolve the issue or just want to see more details about the rule that the message belongs to, you can click on the (?) visible when you hover near a violation message value. This should open the Learn More View with all relevant details.
Violation Severity
Labelled as Severity, this property indicates the severity level of the message.
Violation Location
Labelled as Location, this property shows the file path and the line number and position range within the file at which the issue exists i.e. unlike the cursor position which indicates a single point in the file, this location will contain full information of starting and ending line numbers and positions. If you click on the location information it will also highlight the specific range in the file.
Violation Path
Labelled as Path, this property shows either the breadcrumb path to the particular location or the JSON reference path, whatever is available.
Violation Contextual Data
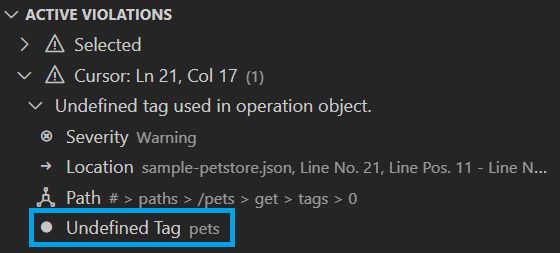
Each issue may have dynamic key-value pairs attached with it that represents additional context for the issue:
Violation Call Trees
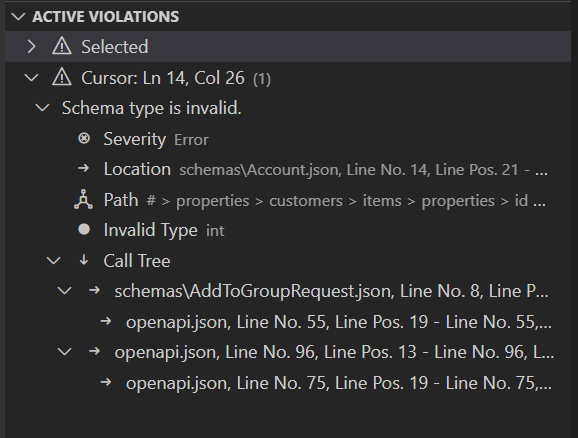
Labelled as Call Tree, this property contains complete data about components referencing the current component in question, using $ref. As the name suggests, this information is represented as a "tree" where the root node is the current component containing the issue and child nodes are components that are directly referencing this component using $ref. Inner children of these child nodes will be nodes directly referencing those nodes using $ref and so on. The purpose of a call tree is to help you understand scenarios where the issue may have originated based on how it was referenced.
Here is an example of an OpenAPI file where the same object is incorrectly referenced as both a Parameter Object and as a response Schema Object:
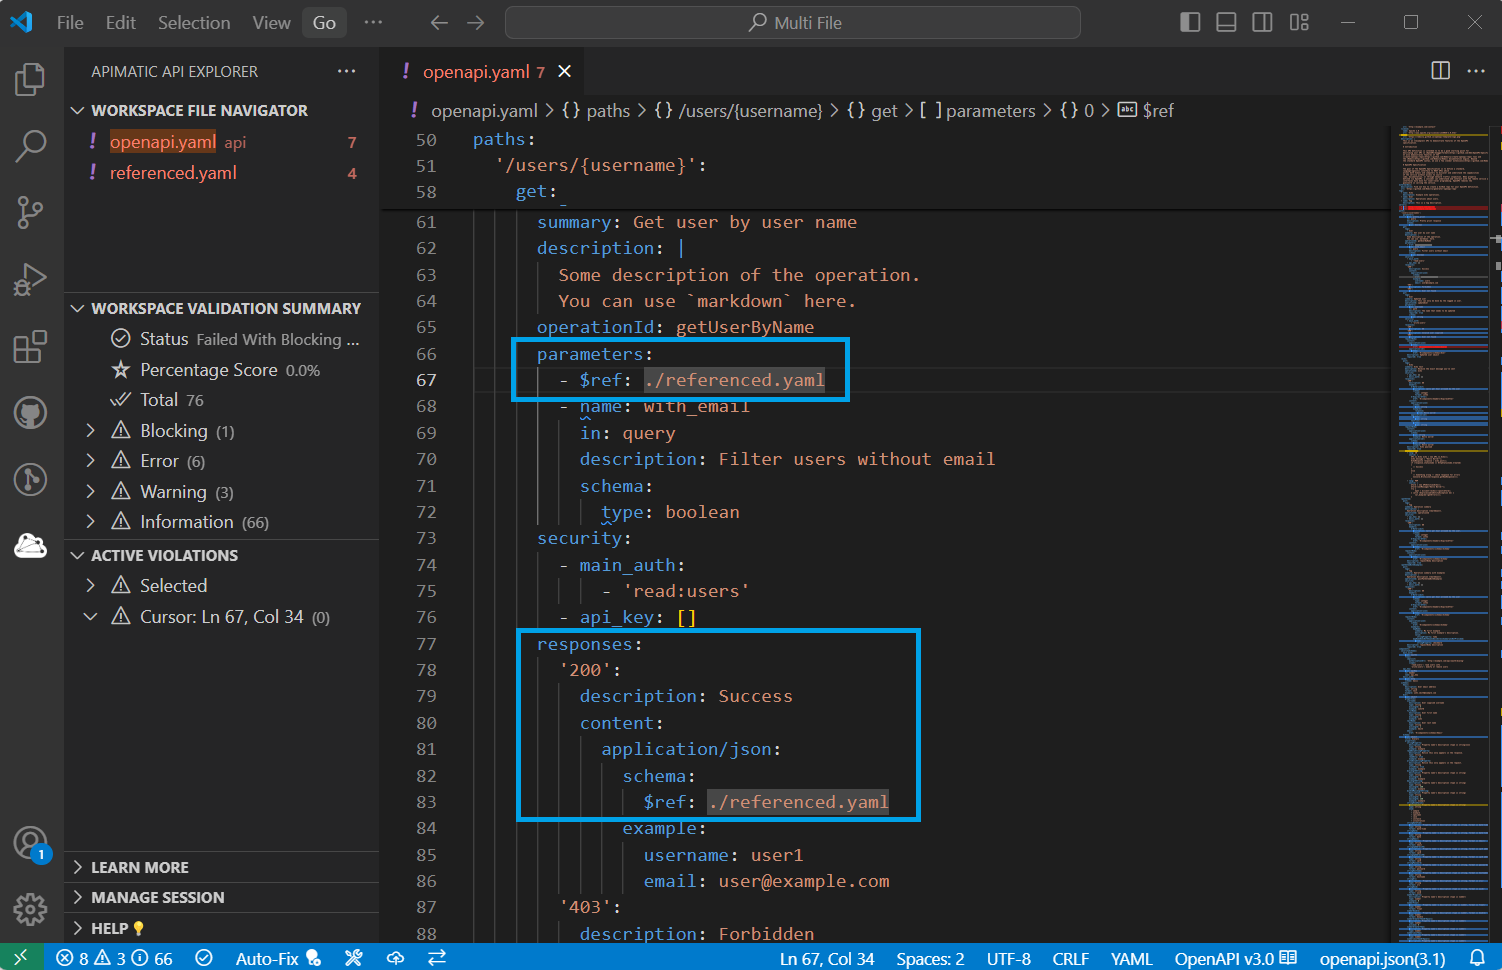
Due to this, the referenced component has an error shown at the required property value:
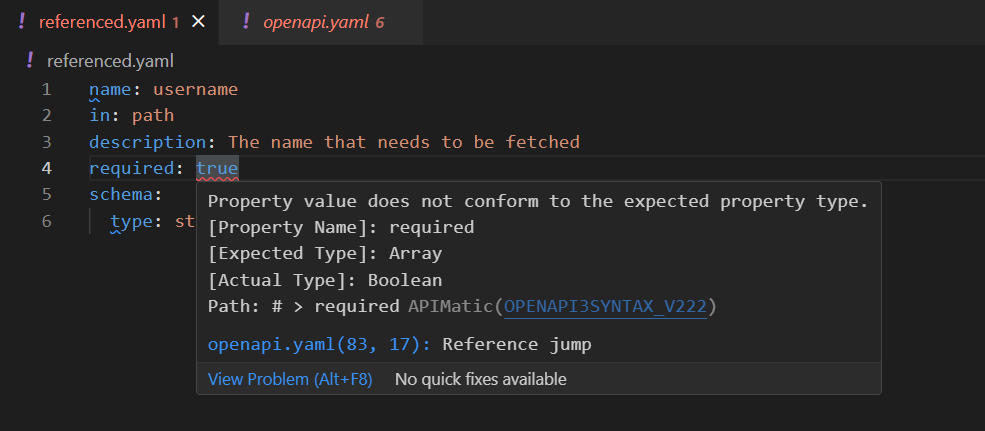
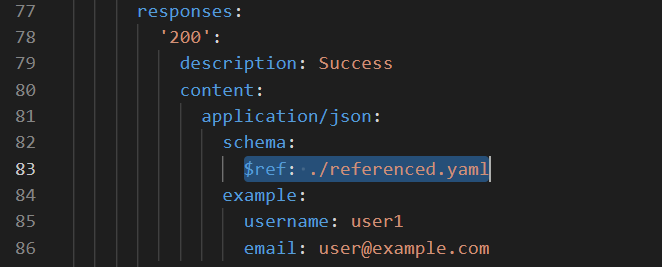
This required property is allowed to be a boolean if it is referenced as a Parameter Object. But the same required property can't be a boolean if it is referenced as a Schema Object. This implies that the error on the property required is due to the incorrect response Schema Object reference:
The call tree helps confirm this by showing only the incorrect response Schema Object reference as the root cause for the error on the required property:
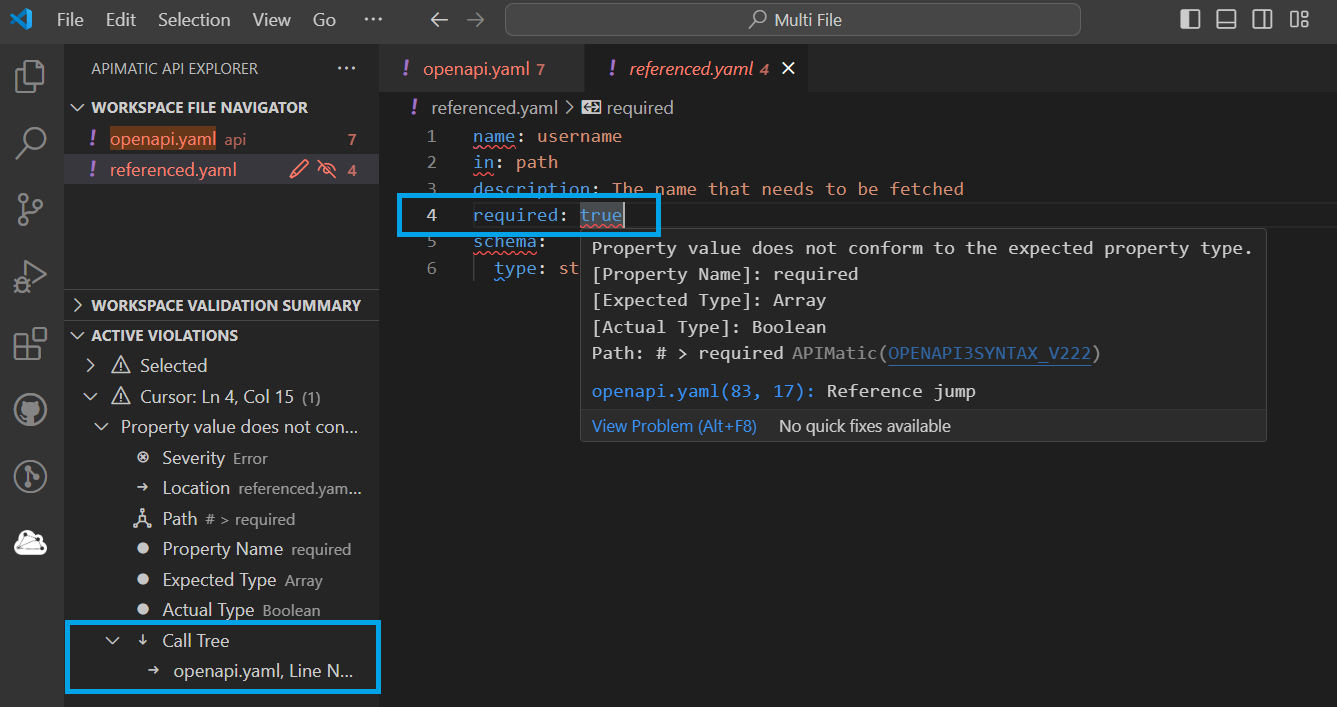
In this way, if the response schema reference is removed, the issue will be resolved. Without a call tree, it would have been difficult to understand the origin of the issue in the referenced component.
Collapse All Nodes
If the information becomes overwhelming you can quickly collapse all nodes of the view using the Collapse All option from the right corner of the view title:
After collapsing, all inner nodes will be collapsed and only the root level ones will be shown:

Learn More View
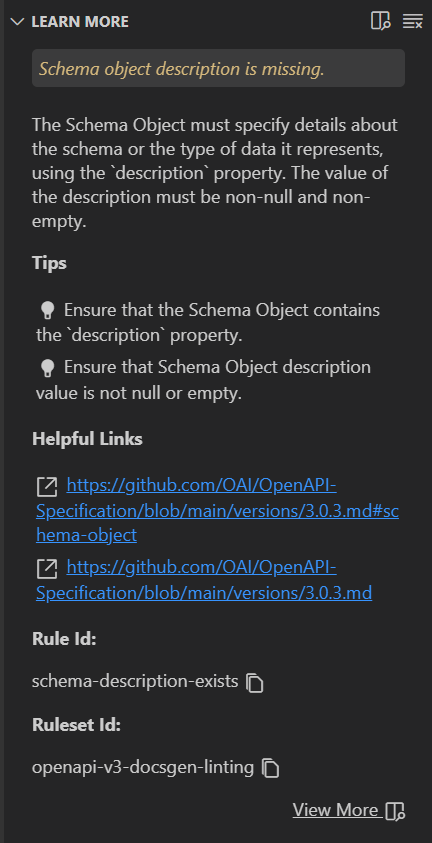
As the name suggests, this view helps you learn more about a particular issue by providing details about the rule associated with the issue. The information listed here is also available for each rule in our official documentation of each ruleset. The goal of providing the same information within the extension is to help save the user's time in searching for details to better understand the issue and to easily view hints for resolving it efficiently.
Open Rule Details in This View
Details of a rule associated with an issue can be opened from:
- Workspace Validation Summary view. Learn more about it here.
- Active Violations view. Learn more about it here.
- Clicking on the message "code" from the Problems view or from the message visible in Editor when hovering over a problem. Learn more about it here.
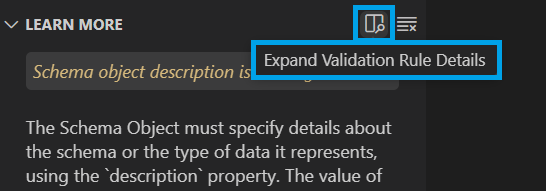
Expand Rule Details
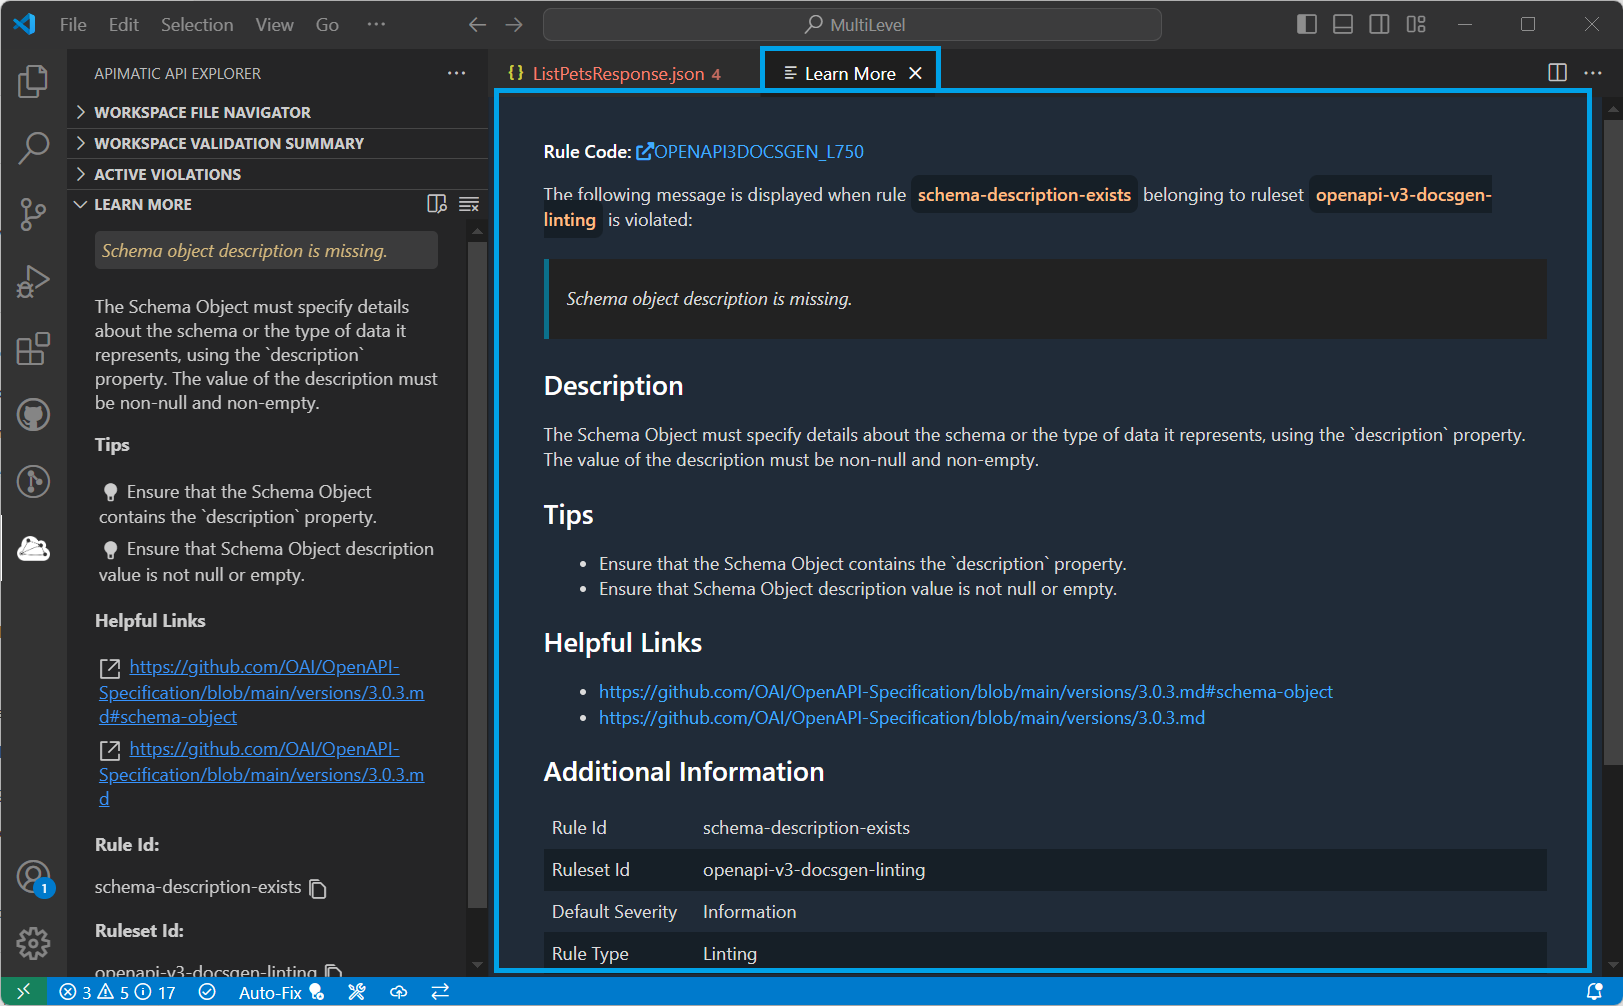
If you feel the need to repeatedly consult the Learn More view details or are having trouble navigating through the details because of the small view area, you can choose to expand the details and open them in a separate Editor tab instead. To do this, simply hover near the view title and click on the Expand Validation Rule Details button:
Or click on the View More option at the bottom of the view:

The details will open in a separate tab as follows:
A detailed breakdown of each property in this view is described below:
| Property | Details |
|---|---|
| Rule Code | A short, unique identifier of the rule among all available rulesets. |
| Message | The message displayed to the user (unless overridden) if this rule is violated. |
| Description | Describes what the rule expects/dictates. |
| Tips | Tips that can be followed to resolve any issues that occur when the rule is violated. |
| Helpful Links | External links that can help provide more information for understanding the issues that occur when the rule is violated. |
| Rule Id | Unique identifier of the rule in a ruleset. |
| Ruleset Id | Unique identifier of the ruleset to which the rule belongs. |
| Default Severity | The default severity of the message which is displayed when the rule is violated. This severity may be overridden via configuration. |
| Rule Type | Whether the rule is a validation rule or a linting rule. |
| Rule System Type | The rule system that this rule belongs to. |
| Category | A broad semantic category of the rule in the ruleset. |
| Tags | Keywords or tags associated with the rule. |
| Possible Impact On | A list of APIMatic products where you can expect your output to be negatively impacted if this rule is violated. |
Copy Rule and Ruleset Id
While configuring validation, you may feel the need to find out a particular rule's id or its ruleset id. The Learn More view can be helpful in such cases as it allows you to copy the relevant ids. Simply hover near the id values in the view and click on the clipboard (📋) icon to copy the value:

Clear the View
To clear the details visible in the view, hover near the view title and click on the Clear Validation Rule Details button in the top right corner:
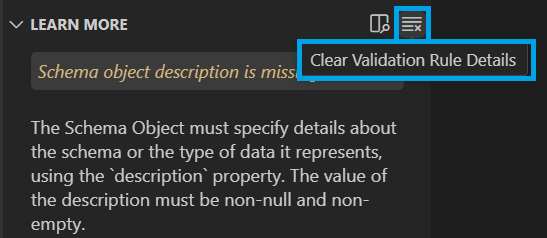
After clicking, details of the rule will be removed from the view until you select any other rule.
Manage Session View
This view contains details about your current session including your name and email information. This information is obtained after you authorize the extension using your APIMatic account:
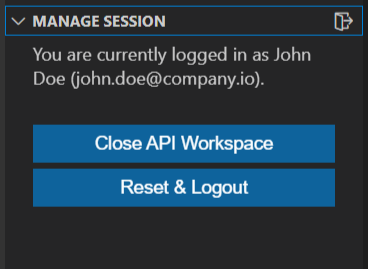
The view also provides options to manage the current session e.g. closing the currently open API workspace (if any) or resetting the session completely.
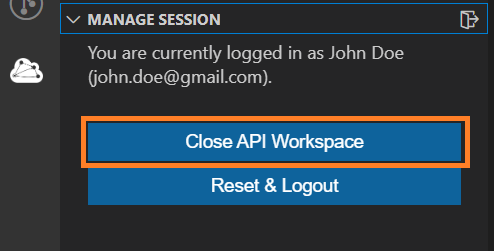
Close the API Workspace
If you have an API workspace currently open in the APIMatic API Explorer, you can close it in the extension by using the Close API Workspace option:
You will be asked to confirm this action before proceeding:
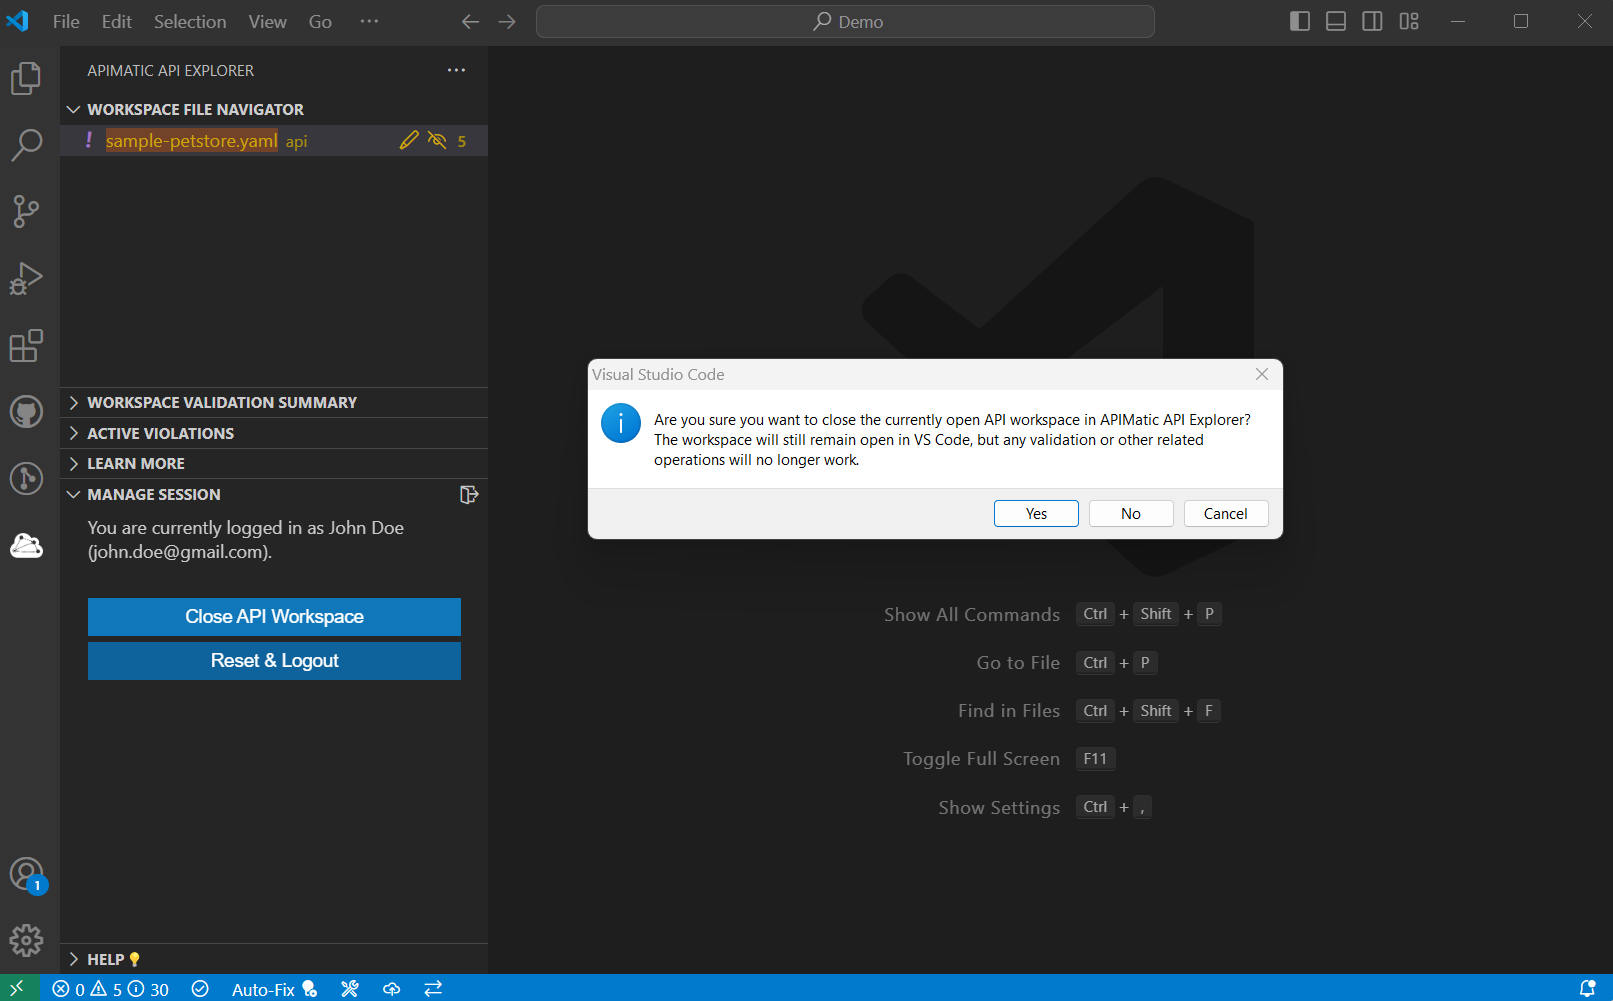
Once closed, validation and other features will not work until the workspace is selected as an API workspace again.
Closing the API workspace will only remove the extension's access to the workspace folder. The workspace folder will still remain open in VS Code.
Reset and Logout
If you wish to log out from the extension, you can click on the Reset & Logout button:
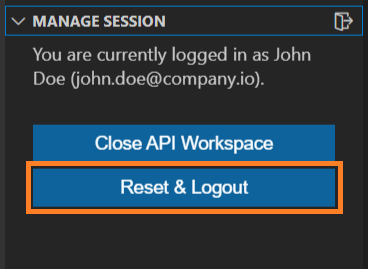
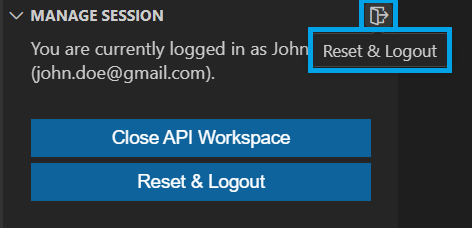
You can also use the right corner option from the view title for the same purpose:
You will be asked to confirm this action before proceeding:
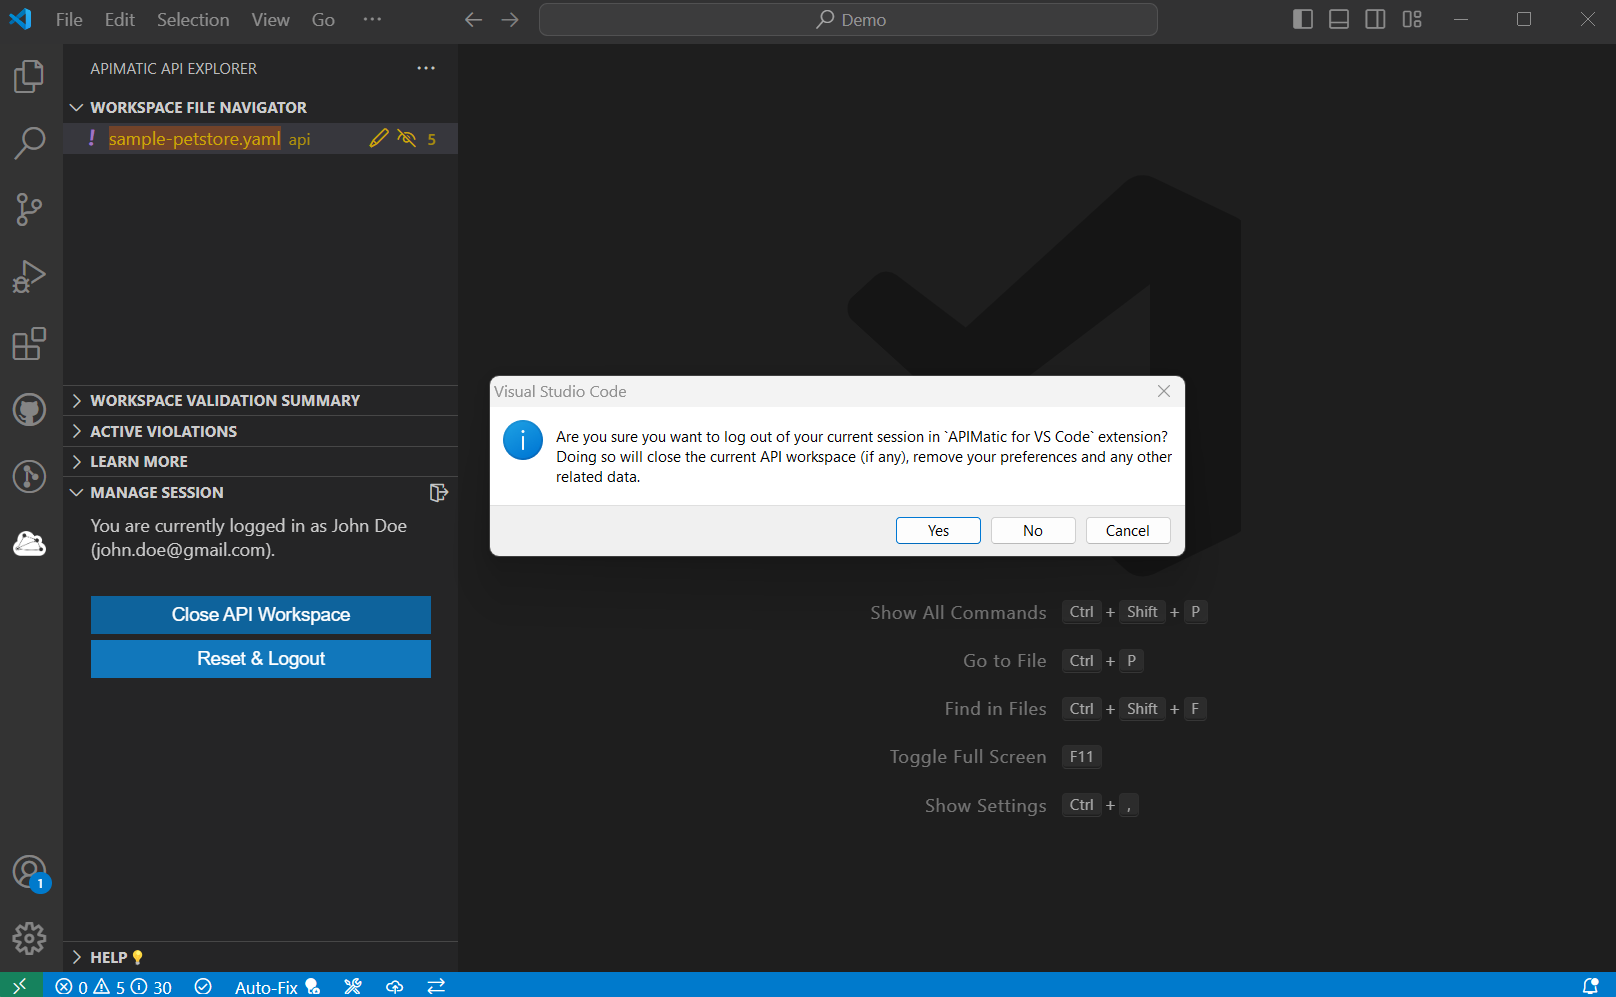
To use the extension after logging out, you will need to authorize yourself with APIMatic again.
Logging out of the extension will only remove your access to the extension functionality and erase personal information from it e.g. name and email, but will not log you out of your APIMatic account elsewhere.
Help 💡 View
As the name suggests, this view contains all relevant links and options to help you get started with the extension.
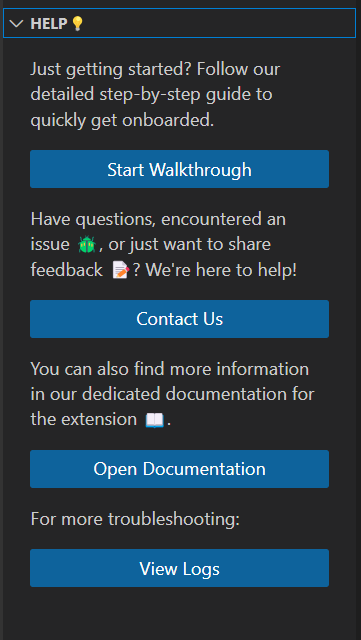
You can use the Start Walkthrough option to open the Getting Started APIMatic walkthrough in your VS Code. To report any issues, share feedback or get your queries answered, you can reach out to the APIMatic team through the Contact Us option or view detailed logs for troubleshooting using the View Logs option. You can also navigate to the dedicated extension documentation using the Open Documentation option.
Status Bar Actions
The APIMatic VS Code extension offers various workspace and editor level actions in the status bar:
![]()
Workspace Actions
In VS Code, actions that affect the whole workspace are located on the left. This is also the case for workspace actions provided by APIMatic in the extension:
![]()
Following workspace actions are available:
- Validating the API Workspace.
- Auto-fixing the API workspace.
- Building the API workspace.
- Exporting the API workspace to APIMatic Dashboard.
- Transforming the API workspace specification format to another.
The status bar may also display status messages from time to time when one of the above processes are running:

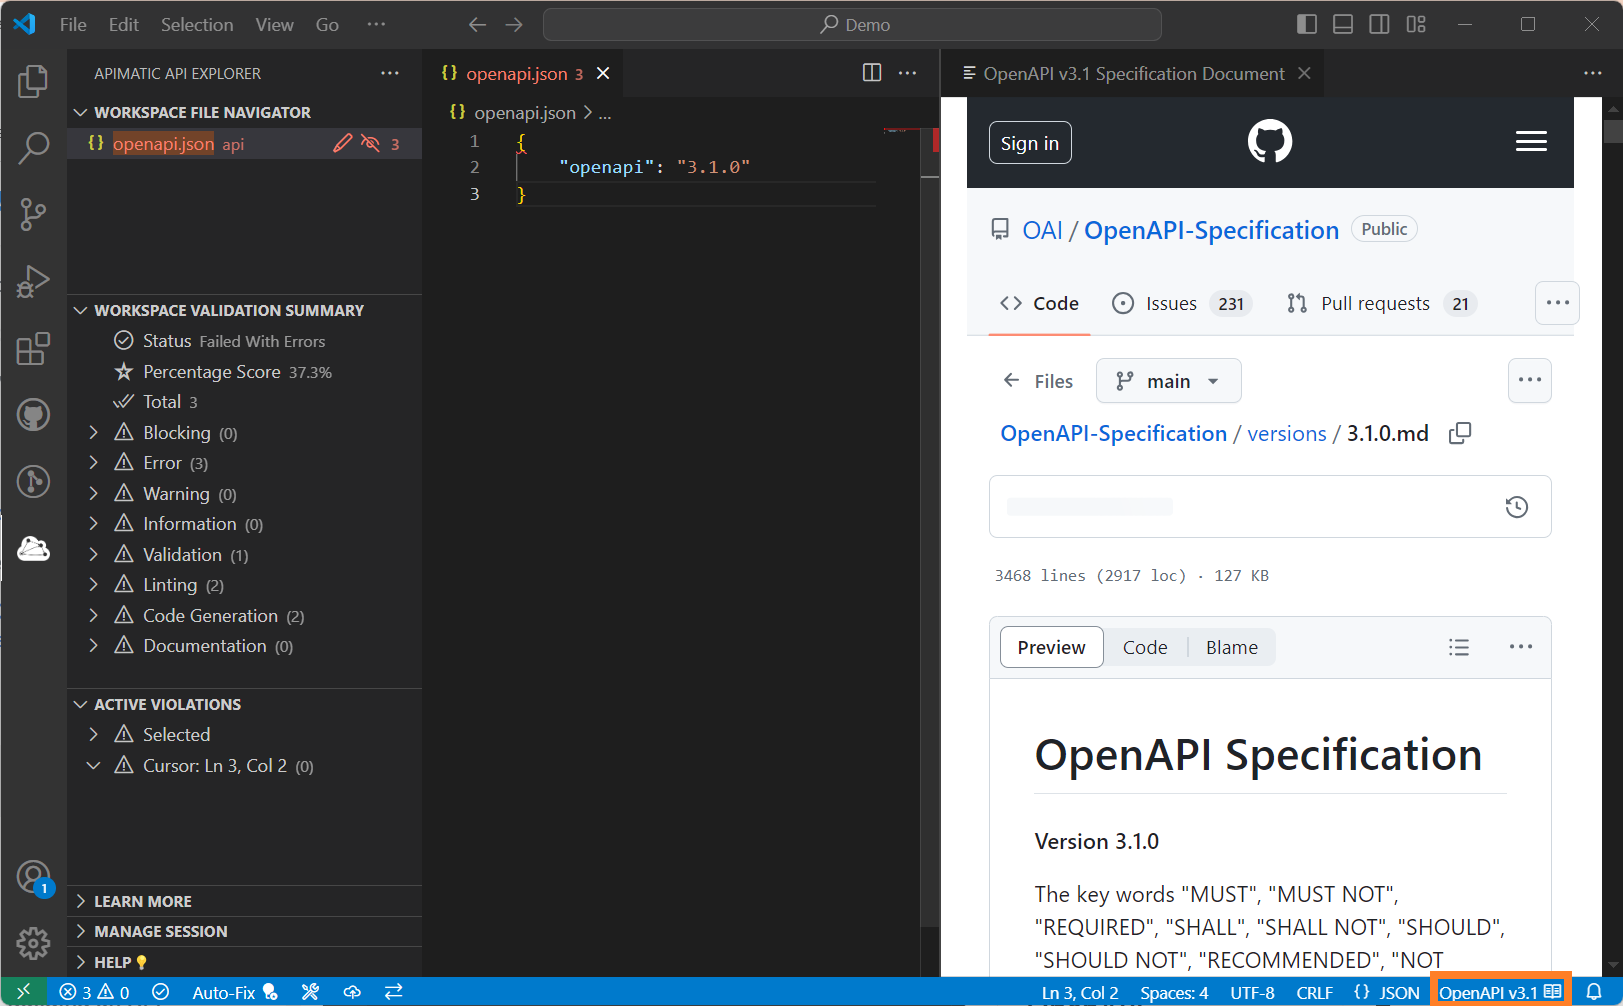
Editor Reference Documentation Action
In VS Code, actions that are contextual or language-specific go towards the right. Accordingly, when working with API files in the Editor, the extension can display the API specification format name with a (📖) icon in the right end of the status bar as shown below:
![]()
Clicking on it will open the reference documentation linked to the specification. Documentation compatible with VS Code (e.g. GitHub URLs) will open within the extension. Others may use your default web browser to show the documentation: